But keeping the color arguments aligned across the app can be tedious as you need to copy / paste the color code many times. It also makes your code less reusable in other projects as it will need to be updated in many places.
Pass colors as arguments of the plot function
Whenever I make a new plot, I always encapsulate the plot layer building into a dedicated function that will be called and return a ggplot2 object (most time it will feed an output with renderPlot()). It makes it much easier to maintain the plot code as you can use it directly from the console for fine tuning, but also to reuse that code for another project.
As you will pass the data as an argument to the plot function, a first approach is to define a variable (typically a named vector) that carries the color codes at the app level and pass it as a parameter of dedicated plot functions.
Code
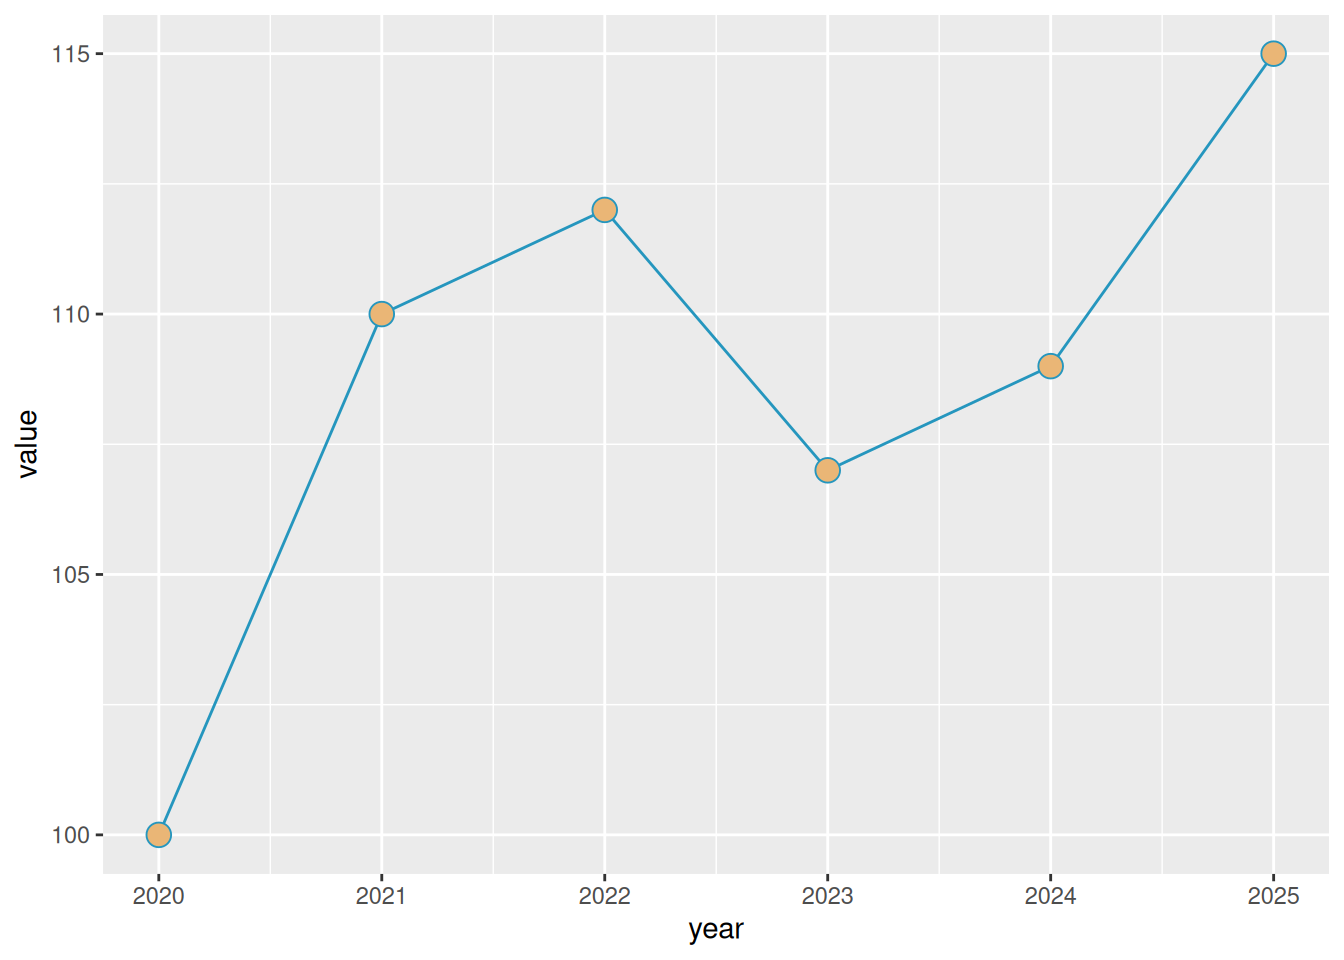
# -- define color variablecolors <-c("primary"="#2596be", "secondary"="#eab676")# -- define plot function with theme argumentbasic_plot <-function(data, theme){# -- build & return plotggplot(data,aes(x = year,y = value)) +geom_line(color = theme['primary']) +geom_point(size =4,shape =21,color = theme['primary'],fill = theme['secondary'])}# -- call function with colorsp <-basic_plot(data, theme = colors)# -- printp
With this, colors can be tuned easily across the app and plot functions can be reused in a different project without much update since you will just update the color variable at the app level.
Code
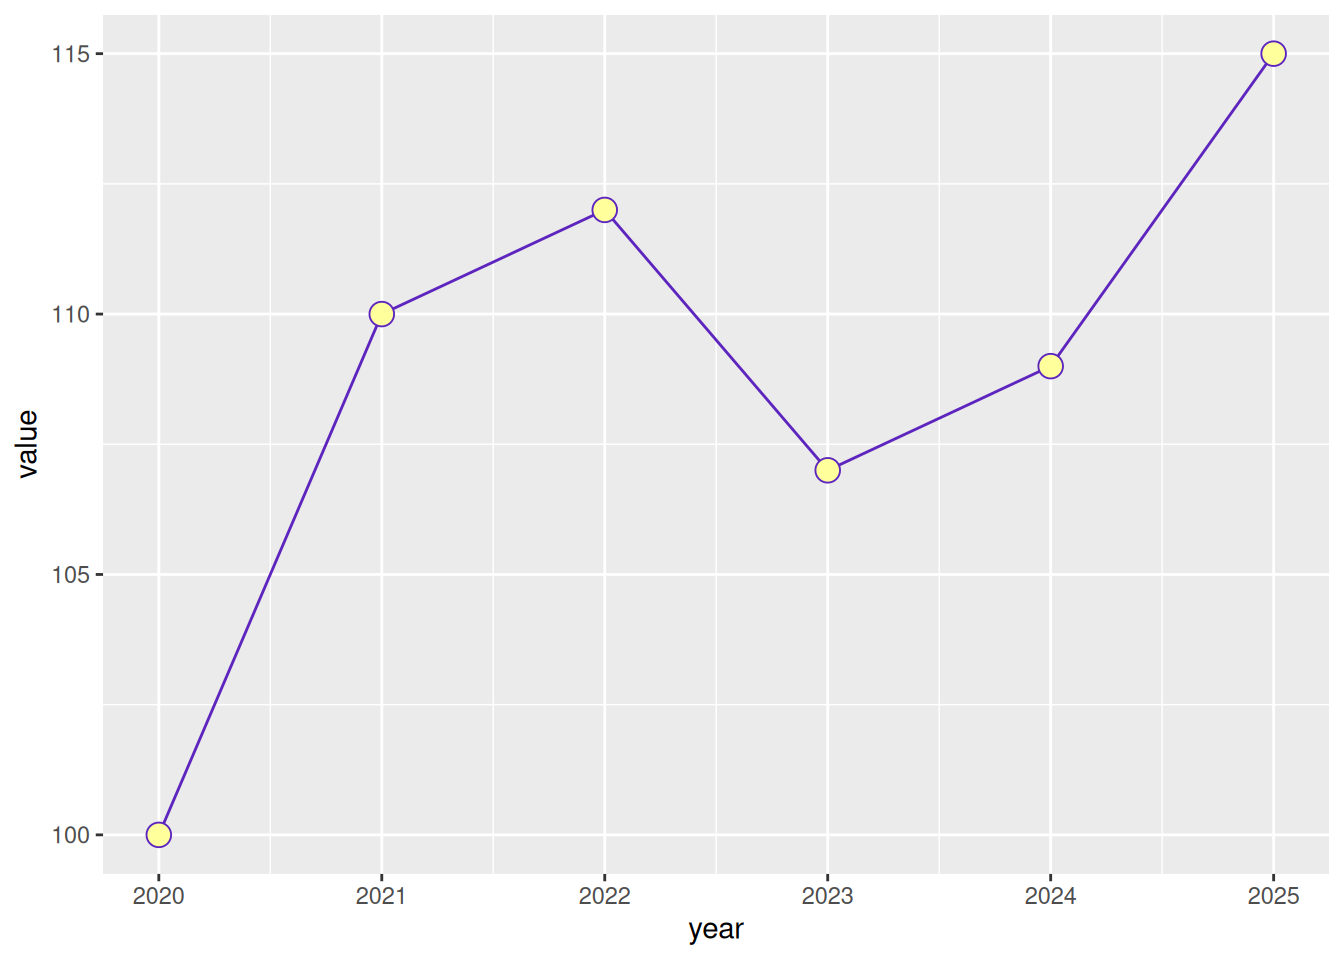
# -- update color variablecolors <-c("primary"="#5d25be", "secondary"="#ffff9b")# -- call function with colorsp <-basic_plot(data, theme = colors)# -- printp
Pass theme colors to the plot function
In case your Shiny app is using bslib to build the ui, then it’s even possible to reuse the global app theme to feed this color variable and share it to all your plots.
To do so, you need - from the server side - to get the current theme that was applied on the ui side.
And bslib has a bs_current_theme() function for that:
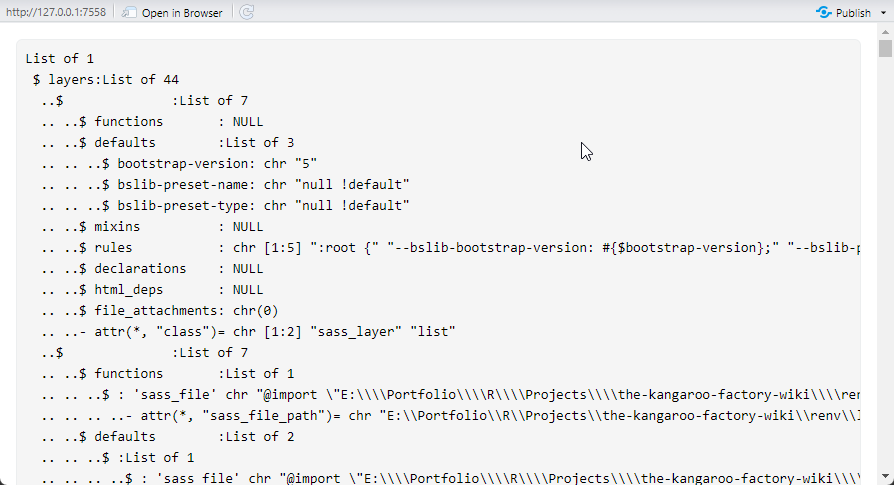
If you have a look into that theme object, you will soon understand that diving into it to get the theme colors won’t be an easy task. Indeed bs_current_theme() returns a bs_theme() object that is itself defined as a sass::sass_bundle() (list-like) object.
Theme object structure
Once again, bslib has made it easy for you and provides a handy bs_get_variables() function to get the colors out of that theme bundle without effort:
Code
# -- Define uiui <-page_fillable(title ="Demo",# -- Set themetheme =bs_theme(bootswatch ="minty"),# -- Display theme object structureuiOutput("theme_colors"))# -- Define serverserver <-function(input, output) {# -- Get theme theme <-bs_current_theme()# -- Get colors from the theme colors <-bs_get_variables(theme, varnames =c("primary", "secondary"))# -- Display theme object structure output$theme_colors <-renderUI(layout_column_wrap(card(card_header(class ="bg-primary"),p("Primary color =", colors['primary']) ),card(card_header(class ="bg-secondary"),p("Secondary color =", colors['secondary']) )))}shinyApp(ui, server)
Now you just need to pass this variable to the plot function we customized in the first step and get your plot match with the global app theme.
Code
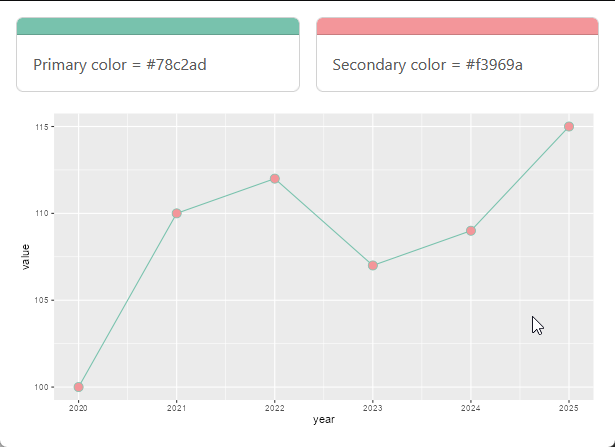
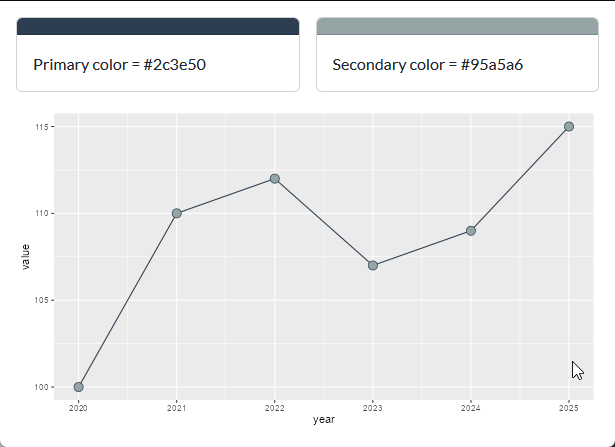
# -- Define uiui <-page_fillable(title ="Demo",# -- Set themetheme =bs_theme(bootswatch ="flatly"),# -- Display theme object structureuiOutput("theme_colors"),plotOutput("plot"))# -- Define serverserver <-function(input, output) {# -- Get theme theme <-bs_current_theme()# -- Get colors from the theme colors <-bs_get_variables(theme, varnames =c("primary", "secondary"))# -- Display theme object structure output$theme_colors <-renderUI(layout_column_wrap(card(card_header(class ="bg-primary"),p("Primary color =", colors['primary']) ),card(card_header(class ="bg-secondary"),p("Secondary color =", colors['secondary']) )))# -- Define plot output output$plot <-renderPlot(basic_plot(data, theme = colors))}shinyApp(ui, server)
Theme minty
Theme flatly
A basic example is provided in the GitHub repository listed below in the references & materials section.